
Every month, the Bank of Uganda publishes a simple table. It shows how much money the country’s banks have lent and which parts of the economy received it. It is not a glamorous document but it tells a truer story about our economy than most speeches do.
We spent the past year looking at that table, and between July 2025 and July 2026, the total lent by Ugandan banks grew from 23.8 trillion to 28.1 trillion shillings. That is a great deal of new money. The interesting question is where it went.
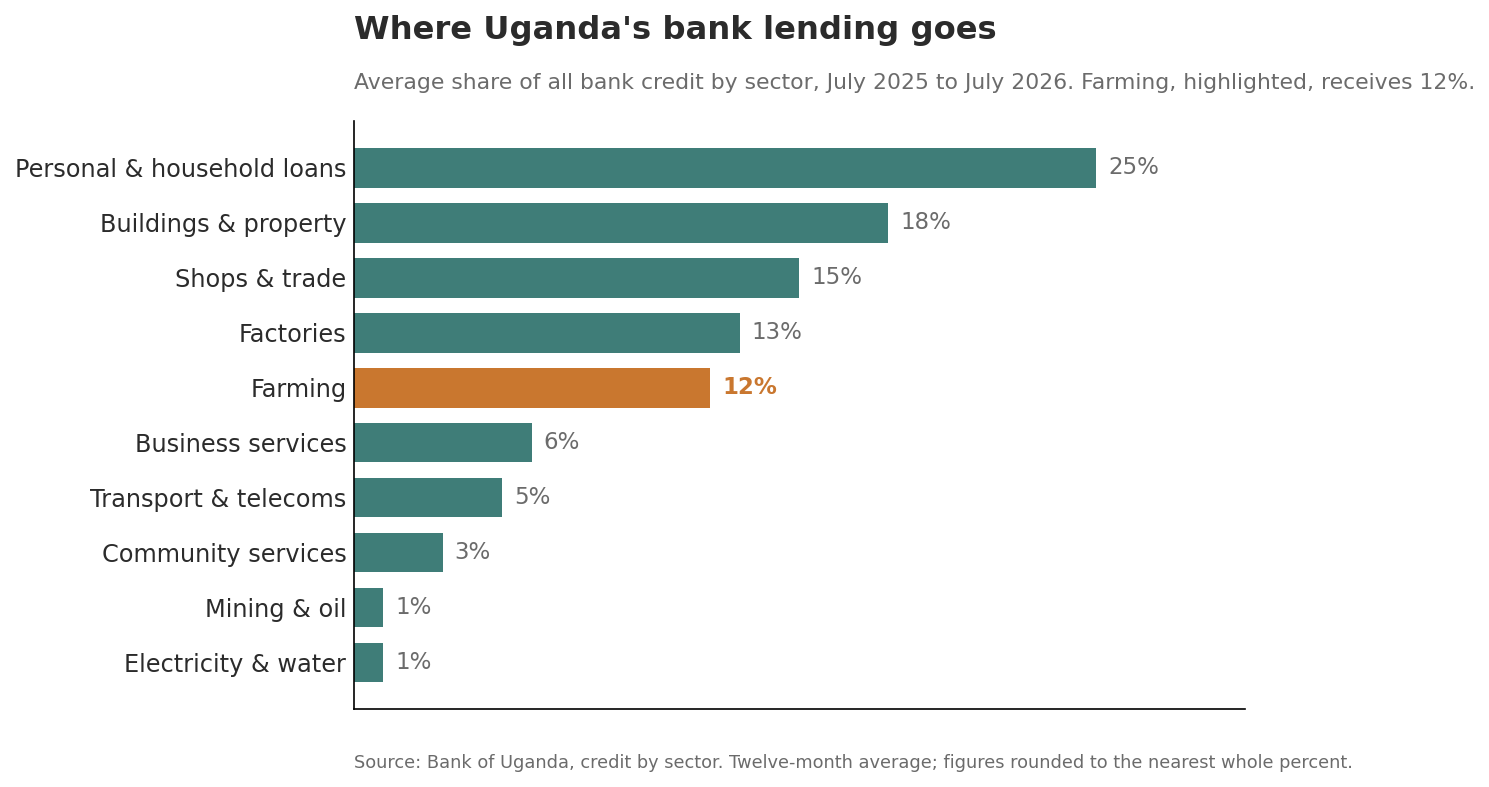
Averaged across the year, the biggest single share, about 25 percent of everything lent, goes to personal and household loans. That is more than any industry receives. It is people borrowing to pay school fees, to buy a phone or a motorcycle, to cover a hospital bill, to get through the weeks before the harvest comes in. Buildings and property take 18 percent. Shops and trade take 15 percent. Factories take 13 percent, while farming, the work that feeds Uganda and employs most of its people, gets 12 percent.
These are averages for the whole year, and the proportions barely moved from one month to the next. This is a signal of how banks lend, month after month, guided by where they believe the money will come back.
Let that sit for a moment. Agriculture employs most of Uganda’s workforce, yet our banks lend more than twice as much for personal spending as they lend to everyone who grows our food.
Three things are changing
Look across the whole year and the picture moves in three directions.
Personal borrowing is not going away, and it grew in step with everything else and kept its place at the top. This is simply how many Ugandan families now get by, and is not a passing phase.
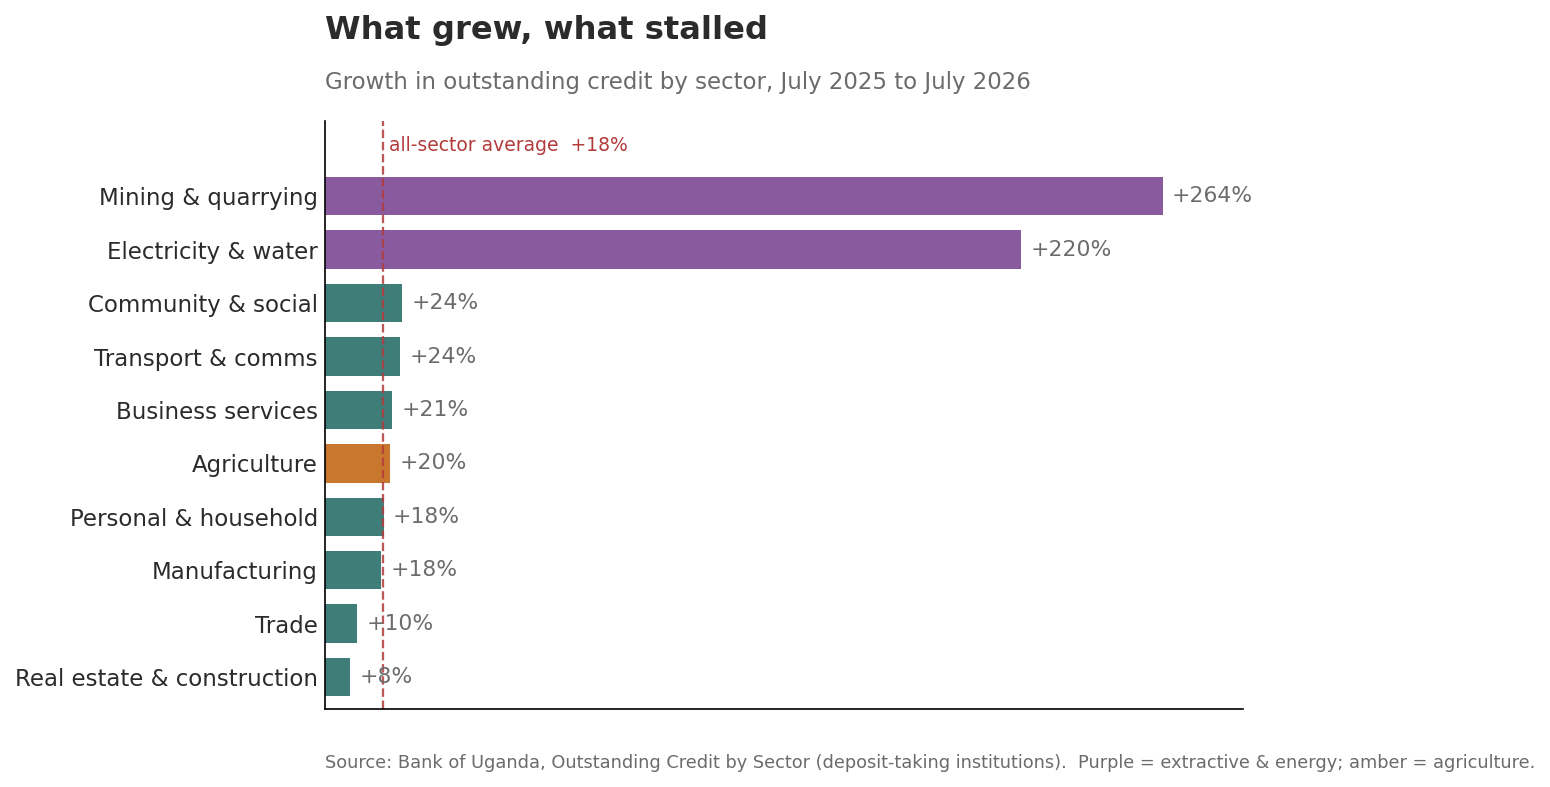
For years the safe bet was to build and to trade, but that is now slowing. Lending to real estate and construction grew only 8 percent over the year, and lending to trade barely 10 percent, both well below the average. Real estate’s share of all lending has slipped from nearly 20 percent two years ago to 17 percent today. The old belief that the smart money is always in buildings and shops is slowly stopping being true.
Part of the explanation may lie outside this table altogether. Government borrowing from Ugandan banks has grown sharply in recent years, and the International Monetary Fund and Bank of Uganda have both pointed to this as a factor squeezing out private lending: banks can earn steady, low-risk returns by buying government securities instead of lending to a builder or a trader. This is one plausible reason private credit to sectors such as property and trade has grown more slowly. It is not the only explanation, and the two effects are difficult to fully separate in a table like this one, but it is a pattern worth watching alongside these numbers.
Lastly, and one to watch, is that the money is moving into the ground. Lending to mining and quarrying grew 264 percent in a single year. Lending to oil and gas, which was almost nothing two years ago, multiplied more than five times over. Lending for electricity and water also grew fast, up 220 percent, part of a wider push to build out power and infrastructure as the country prepares for oil production to begin. These are still small amounts today, but this is what the beginning of something looks like. The oil economy we have talked about for so long is no longer just talk. You can now watch the banks preparing for it, month by month, in this one table.
What about the farmers?
Farming did grow this year, by about 20 percent, slightly better than average. That is welcome, and worth acknowledging. But farming started from such a low base that its share of total lending barely moved, from 11.5 percent to 11.7 percent. Agriculture employs most of the country’s workforce, yet it continues to receive a modest share of formal bank credit relative to that role. Whether that gap should close, and how, is a question for policymakers, lenders and farmers to work through together.
What the table cannot tell us
Somewhere in that 12 percent for farming is a trader in Lyantonde and a family farming a few acres in the Lango subregion, but the table cannot see them, and neither, really, can we. A number this large should not be this anonymous.
At Amara Hub, our work has shown us how much economic activity, particularly the work women do on the farm and in the market, sits outside the formal records that shape national policy. This is not a criticism of the central bank’s data, which does exactly what it sets out to do. However, it is an observation about what any national, sector-level table currently leaves out. If lending data were also published by region and by the gender of the borrower, local leaders, researchers and lenders would have a fuller picture to work from. Until then, the table can only tell us how much was lent, but not to whom, or where.
About the data
Figures are drawn from the Bank of Uganda’s statistical portal, credit by sector, to July 2026.
Work on economic data, financial inclusion or regional policy and would like to explore this analysis further? Contact us via team (at) amarahub (dot) org.