
In January, fifteen women spent two weeks documenting their daily lives to contribute to our photovoice research on climate and care. Their pictures showed longer walks for water, fuelwood trips that take whole mornings, more childcare during drought months, and routines women skip because no one else will cook at home.
When the photographs were presented at a community baraza, 173 people attended. A local government official summed up the discussion: the community has always been asked to support climate adaptation and restoration, but nobody has accounted for what that asks of the women caring for every household in it.
That left us with a familiar problem. We had strong qualitative evidence about who these caregivers are, and a monitoring panel of 80 households doing structured monthly interviews on KoboToolbox and producing numbers about workloads and income. The two didn’t connect. Stories couldn’t answer “how many?” Our panel average couldn’t answer “who?” Local government officials asked us both these questions.
The methodology we borrowed
Quicksand, a design research studio, faced the same problem at national scale in their Digital Personas work. Instead of clustering or training a classifier, they wrote plain rules by hand that assign every survey respondent to a qualitatively-derived persona.
We applied the same approach to our 80-household panel.
Five Ways to Carry a Household
From the photovoice themes and the baraza records, we defined five caregiver types. They are built on three variables our fieldwork showed to be decisive: whether care is shared within the household, whether the caregiver earns from a food enterprise, and whether sharing is possible at all in her household.
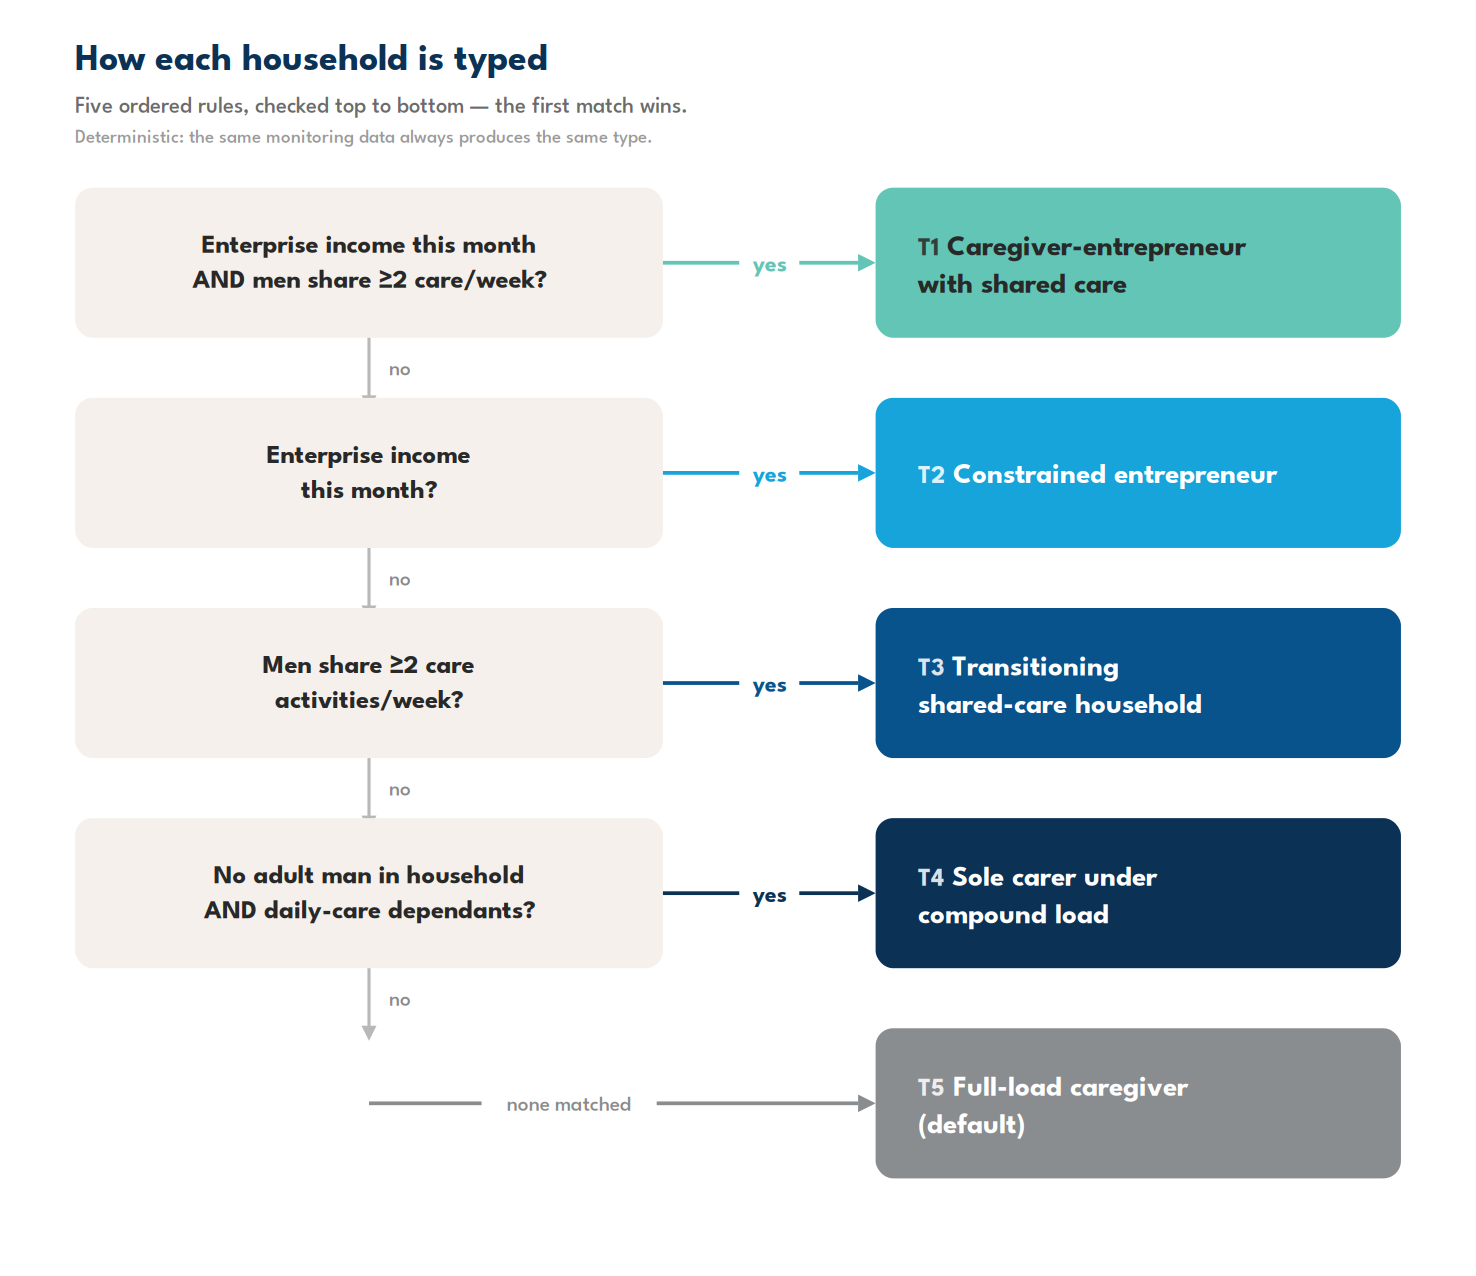
- T1 — Caregiver-entrepreneur with shared care. Care redistributed and income earned. The full CARES pathway.
- T2 — Constrained entrepreneur. Earning, but with no reduction in care load. A double burden.
- T3 — Transitioning household. Men now doing regular care work like collecting water, cooking some evenings, but no enterprise yet.
- T4 — Sole carer under compound load. No adult man in the household, plus dependants needing daily care. Redistribution within the household is not an option. These households are who the shared care pod is for.
- T5 — Full-load caregiver. An adult man present; care still done by the woman alone. This is the group the programme is trying to shrink.
What it changes
Prevalence. We can now show how many households fall into each type and track how this changes over time. After six months, the number of full-load caregivers in our project, women carrying all the household’s care responsibilities alone, fell from 45 households to 22 as care was shared more equally and additional support reached them.
Movement. The transition matrix shows how individual households are changing, rather than only presenting overall averages. In our study, seventeen households moved from full-load caregiving into the transitioning group, while six completed the full pathway. However, eleven sole caregivers did not move at all. Household dialogue cannot redistribute care when there is no one else in the household to share it with. This provides measurable evidence of the need for community-based care services and support.
Disaggregation. We can break down any measure by household type. In our study, constrained entrepreneurs spent an average of 8.9 hours a day on care work, the second-highest level after sole caregivers. Photovoice participants had already explained that earning an income does not automatically reduce care responsibilities. The typology helps us measure that pattern.
Advocacy. The characteristics used to define the household types, such as household composition and the number of dependants, are also available in census and Demographic and Health Survey data. This allowed us to estimate how many caregivers across our study population may face similar conditions, use those estimates to make realistic requests to local government, and then record and follow up on the commitments made.
Caveats
The household types are not permanent labels since families can move from one type to another, and the matrix will track movement in both directions. The boundaries between the types are based on our researchers’ judgement, not on fixed statistical cut-off points. With only 80 households, the study can describe patterns but cannot make broad statistical claims. Also, correlations in the data show that two things may be linked, but they do not prove that one caused the other. The photographs, diaries and dialogue records help explain what is actually happening.
Get the working paper
Our paper explains the methodology, including the four open KoboToolbox forms, the analysis process, the statistics used and their limitations, and how the findings are linked to the wider population. The forms and the script used to classify households are also openly available for others to adapt and reuse.
If you work on care, climate or livelihoods programs and would like to test this approach or challenge where we have drawn the boundaries between household types, contact us via team (at) amarahub (dot) org.